How Do You Calculate Drayage Rate
What is drayage and why is rate calculation important?
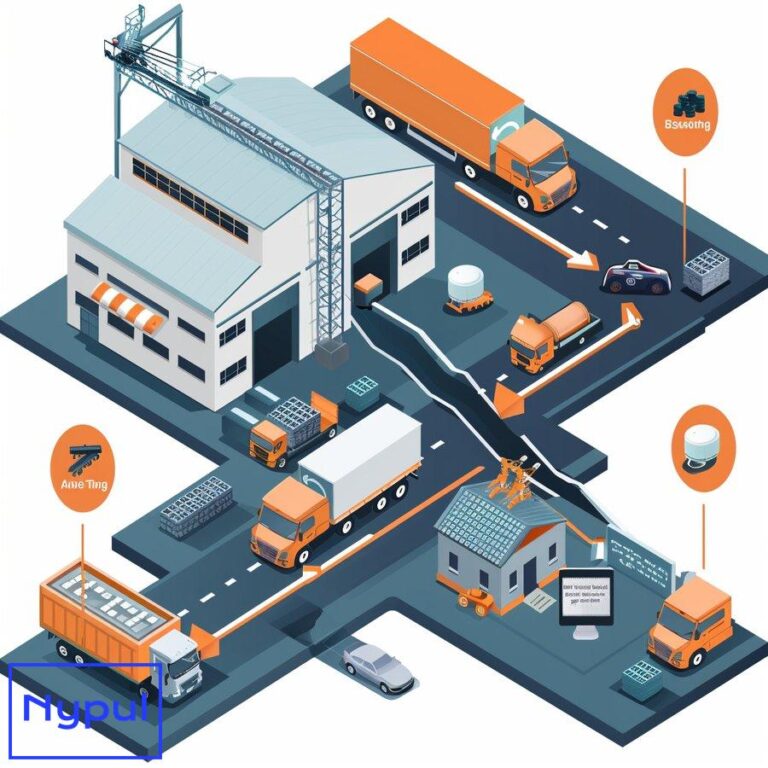
Drayage is the transportation of goods over a short distance, often from a port or rail terminal to a warehouse or other final destination. It is a crucial link in the supply chain, connecting the long-haul transportation of goods via ship or train to their final delivery point.


Calculating accurate drayage rates is essential for several reasons:
Budgeting and cost control: Shippers need to know their transportation costs to effectively budget and manage their supply chain expenses. Inaccurate drayage rate calculations can lead to cost overruns and financial strain.
Carrier selection: Understanding the components of drayage rates allows shippers to compare rates between carriers and select the most cost-effective option that meets their service requirements.
Pricing negotiations: Knowing how drayage rates are calculated gives shippers leverage in pricing negotiations with carriers. They can identify areas where costs may be reduced or service levels improved.
Efficiency and competitiveness: Optimizing drayage rates contributes to a more efficient and cost-effective supply chain, which can give shippers a competitive advantage in their industry.
What are the key components of a drayage rate?
A drayage rate typically consists of several key components:
Base rate: This is the flat fee charged by the carrier for the transportation service, based on factors such as distance, equipment type, and cargo weight or volume.
Fuel surcharge: A variable fee that accounts for fluctuations in fuel prices. It is typically calculated as a percentage of the base rate and can change frequently based on market conditions.
Accessorial fees: Additional charges for services beyond the standard transportation, such as:
– Detention: Fees charged when a driver is delayed at the pickup or delivery location beyond a specified time window.
– Demurrage: Fees charged when a container is not picked up or returned within the allotted free time at the port or rail terminal.
– Chassis rental: Fees for the use of a chassis to transport the container.
– Layover: Fees charged when a driver must wait overnight for a pickup or delivery.
– Stop-offs: Fees for additional stops along the route to pick up or deliver cargo.
Port or terminal fees: Charges assessed by the port or rail terminal for handling and processing the cargo, such as security fees, clean truck fees, or terminal handling charges.
How do you calculate the base rate for drayage?
The base rate for drayage is determined by several factors:
Distance: The mileage between the pickup and delivery locations. Carriers typically use zip codes to calculate the distance and may have a minimum mileage charge.
Equipment type: The size and type of container or trailer required for the shipment. Standard equipment types include:
– 20-foot dry container
– 40-foot dry container
– 40-foot high cube container
– 53-foot dry van
– 53-foot refrigerated trailer
Weight or volume: The cargo’s weight in pounds or tons, or its volume in cubic feet. Carriers may have a maximum weight limit per container or trailer.
To calculate the base rate, carriers use a rate matrix or table that cross-references the equipment type and distance. For example:
| Miles | 20′ Dry | 40′ Dry | 40′ HC | 53′ Dry Van | 53′ Reefer |
|---|---|---|---|---|---|
| 0-50 | $250 | $300 | $325 | $350 | $400 |
| 51-100 | $350 | $400 | $425 | $450 | $500 |
| 101-150 | $450 | $500 | $525 | $550 | $600 |
The carrier will then apply any weight or volume surcharges based on their specific rate structure. For instance, a carrier may charge an additional $50 for every 10,000 pounds over a 40,000-pound base weight.
How do fuel surcharges and accessorial fees impact drayage rates?
Fuel surcharges are a significant variable in drayage rates, as they can fluctuate frequently based on market fuel prices. Carriers typically calculate fuel surcharges as a percentage of the base rate, using a formula that accounts for the average price of diesel fuel in the region.

For example, a carrier may use a fuel surcharge scale that looks like this:
| Fuel Price/Gallon | Surcharge Percentage |
|---|---|
| $2.00 – $2.49 | 5% |
| $2.50 – $2.99 | 10% |
| $3.00 – $3.49 | 15% |
| $3.50 – $3.99 | 20% |
If the base rate for a shipment is $500 and the average fuel price is $3.25 per gallon, the fuel surcharge would be 15% of $500, or $75.
Accessorial fees can also add significant costs to a drayage shipment. These fees are typically assessed on a per-occurrence basis and can vary widely between carriers.
Common accessorial fees and their potential impact include:
Detention: If a driver is delayed at the pickup or delivery location beyond the allotted free time (typically 1-2 hours), detention fees can accrue at a rate of $50-$100 per hour.
Demurrage: If a container is not picked up or returned to the port or rail terminal within the allotted free time (typically 4-7 days), demurrage fees can accrue at a rate of $50-$150 per day.
Chassis rental: If the carrier provides a chassis for the shipment, rental fees can range from $25-$50 per day.
Layover: If a driver must wait overnight for a pickup or delivery, layover fees can range from $150-$300 per night.
Stop-offs: If a shipment requires additional stops along the route, stop-off fees can range from $50-$150 per stop.
To accurately calculate the total drayage rate, shippers must account for the potential impact of these accessorial fees based on their specific shipment requirements and the carrier’s fee structure.
What factors can affect drayage rates?
In addition to the key components of a drayage rate, several other factors can influence the final cost:
Market conditions: Supply and demand for drayage services in a given region can impact rates. During peak shipping seasons or in high-volume ports, rates may be higher due to increased demand and limited carrier capacity.
Cargo type: The nature of the cargo can affect rates, particularly if it requires specialized equipment or handling. Hazardous materials, oversized cargo, or temperature-controlled goods may incur additional fees.
Driver availability: A shortage of qualified drivers in a region can lead to higher rates, as carriers must pay more to attract and retain drivers.
Congestion and wait times: Ports and rail terminals with high congestion and long wait times can result in higher accessorial fees for detention and demurrage.
Regulatory compliance: Compliance with government regulations, such as customs requirements, safety inspections, or environmental standards, can increase costs for carriers, which may be passed on to shippers through higher rates.
Carrier competition: The level of competition among drayage carriers in a region can impact rates. In markets with many carriers, rates may be lower due to increased price competition.
Shipment frequency: Shippers with a high volume of regular shipments may be able to negotiate lower rates with carriers based on their consistent business.
By understanding these factors, shippers can better anticipate potential rate fluctuations and make informed decisions when selecting carriers and negotiating rates.
How can you use tools and resources to calculate drayage rates?

There are several tools and resources available to help shippers calculate and compare drayage rates:
Online rate calculators: Many drayage carriers offer online rate calculators on their websites, allowing shippers to input their shipment details and receive an estimated rate quote. These calculators typically account for factors such as origin and destination zip codes, equipment type, and cargo weight or volume.

Rate benchmarking tools: Third-party logistics providers and freight marketplaces often provide rate benchmarking tools that allow shippers to compare rates from multiple carriers in a given region. These tools can help shippers identify competitive rates and make informed carrier selections.
Freight rate databases: Subscription-based freight rate databases, such as DAT or Truckstop.com, provide historical and current rate data for various transportation modes, including drayage. Shippers can use these databases to benchmark their rates against market averages and identify trends over time.
Carrier rate sheets: Drayage carriers typically provide rate sheets to shippers upon request, outlining their base rates, fuel surcharge scales, and accessorial fees. By comparing rate sheets from multiple carriers, shippers can identify the most cost-effective options for their specific needs.
Logistics software: Transportation management systems (TMS) and other logistics software can help shippers automate the process of calculating and comparing drayage rates. These systems can integrate with carrier rate databases, apply complex rating algorithms, and account for accessorial fees to provide accurate rate estimates.
By leveraging these tools and resources, shippers can more effectively calculate and compare drayage rates, ensuring they are getting the best value for their transportation spend.
What are common pitfalls in drayage rate calculation?
When calculating drayage rates, shippers may encounter several common pitfalls that can lead to inaccurate estimates or unexpected costs:
Failing to account for accessorial fees: Shippers may focus solely on the base rate and fuel surcharge when comparing carrier rates, overlooking the potential impact of accessorial fees. This can lead to underestimating the total cost of a shipment, particularly if the shipment is subject to detention, demurrage, or other additional charges.

Using outdated or incomplete rate data: Shippers may rely on historical rate data or incomplete rate sheets when calculating drayage costs, failing to account for recent market fluctuations or carrier-specific fees. This can result in inaccurate rate estimates and budgeting discrepancies.
Misclassifying cargo: Inaccurately classifying cargo based on its weight, dimensions, or commodity type can lead to incorrect rate calculations. Shippers must ensure they are using the correct equipment type and accurately declaring the nature of their cargo to avoid rate discrepancies or compliance issues.
Neglecting to consider market conditions: Failing to account for current market conditions, such as peak shipping seasons, carrier capacity constraints, or regional disruptions, can result in underestimating rates or difficulty securing carrier services at the expected price point.
Overlooking carrier service levels: Shippers may focus solely on cost when selecting a drayage carrier, neglecting to consider the carrier’s service levels, reliability, and communication capabilities. This can lead to hidden costs in the form of delays, missed deliveries, or poor customer service.
Not negotiating rates: Shippers may accept carrier rates at face value, missing opportunities to negotiate better terms based on their shipping volume, frequency, or long-term business potential. Failing to negotiate rates can result in overpaying for drayage services.
By being aware of these common pitfalls and taking steps to avoid them, shippers can ensure more accurate and effective drayage rate calculations, leading to better budgeting, carrier selection, and overall supply chain efficiency.
Case Studies: Real-World Drayage Rate Calculations

To illustrate the process of calculating drayage rates in practice, let’s consider two real-world case studies:

Case Study 1: ABC Importers
ABC Importers is a mid-sized company that regularly ships 40-foot containers from the Port of Los Angeles to their warehouse 50 miles away. They are comparing rates from two drayage carriers:
Carrier A:
– Base rate for 40′ dry container, 0-50 miles: $400
– Fuel surcharge: 15% of base rate
– Detention fee: $75 per hour after 2 hours free time
– Chassis rental: $25 per day
Carrier B:
– Base rate for 40′ dry container, 0-50 miles: $375
– Fuel surcharge: 20% of base rate
– Detention fee: $100 per hour after 1 hour free time
– Chassis rental: $30 per day
To calculate the total drayage rate for each carrier, ABC Importers must consider their specific shipment details. They estimate that their container will require 3 hours of detention time and 2 days of chassis rental.
Carrier A total rate:
– Base rate: $400
– Fuel surcharge: $400 x 15% = $60
– Detention fee: (3 hours – 2 hours free) x $75/hour = $75
– Chassis rental: 2 days x $25/day = $50
– Total rate: $400 + $60 + $75 + $50 = $585
Carrier B total rate:
– Base rate: $375
– Fuel surcharge: $375 x 20% = $75
– Detention fee: (3 hours – 1 hour free) x $100/hour = $200
– Chassis rental: 2 days x $30/day = $60
– Total rate: $375 + $75 + $200 + $60 = $710
In this case, despite Carrier B having a lower base rate, Carrier A is the more cost-effective option for ABC Importers due to their lower fuel surcharge, detention fees, and chassis rental costs.
Case Study 2: XYZ Exports
XYZ Exports is a large company that ships 20-foot containers from their factory to the Port of Savannah, a distance of 200 miles. They are comparing rates from two drayage carriers:
Carrier C:
– Base rate for 20′ dry container, 151-250 miles: $600
– Fuel surcharge: 12% of base rate
– Stop-off fee: $75 per stop
– Layover fee: $200 per night
Carrier D:
– Base rate for 20′ dry container, 151-250 miles: $550
– Fuel surcharge: 15% of base rate
– Stop-off fee: $100 per stop
– Layover fee: $250 per night
XYZ Exports requires one additional stop along the route to pick up palletized cargo and estimates that the driver will need to layover for one night.
Carrier C total rate:
– Base rate: $600
– Fuel surcharge: $600 x 12% = $72
– Stop-off fee: 1 stop x $75/stop = $75
– Layover fee: 1 night x $200/night = $200
– Total rate: $600 + $72 + $75 + $200 = $947
Carrier D total rate:
– Base rate: $550
– Fuel surcharge: $550 x 15% = $82.50
– Stop-off fee: 1 stop x $100/stop = $100
– Layover fee: 1 night x $250/night = $250
– Total rate: $550 + $82.50 + $100 + $250 = $982.50
For XYZ Exports, Carrier C offers the more cost-effective solution, primarily due to their lower stop-off and layover fees, which offset their slightly higher base rate.
These case studies demonstrate the importance of considering all rate components and shipment-specific factors when calculating and comparing drayage rates. By thoroughly evaluating each carrier’s offering and applying the rate calculations to their unique shipping scenarios, companies can make informed decisions that optimize their transportation costs and overall supply chain efficiency.


