How Do Ships and Ports Contribute to Air Pollution
What is the scale of maritime air pollution?
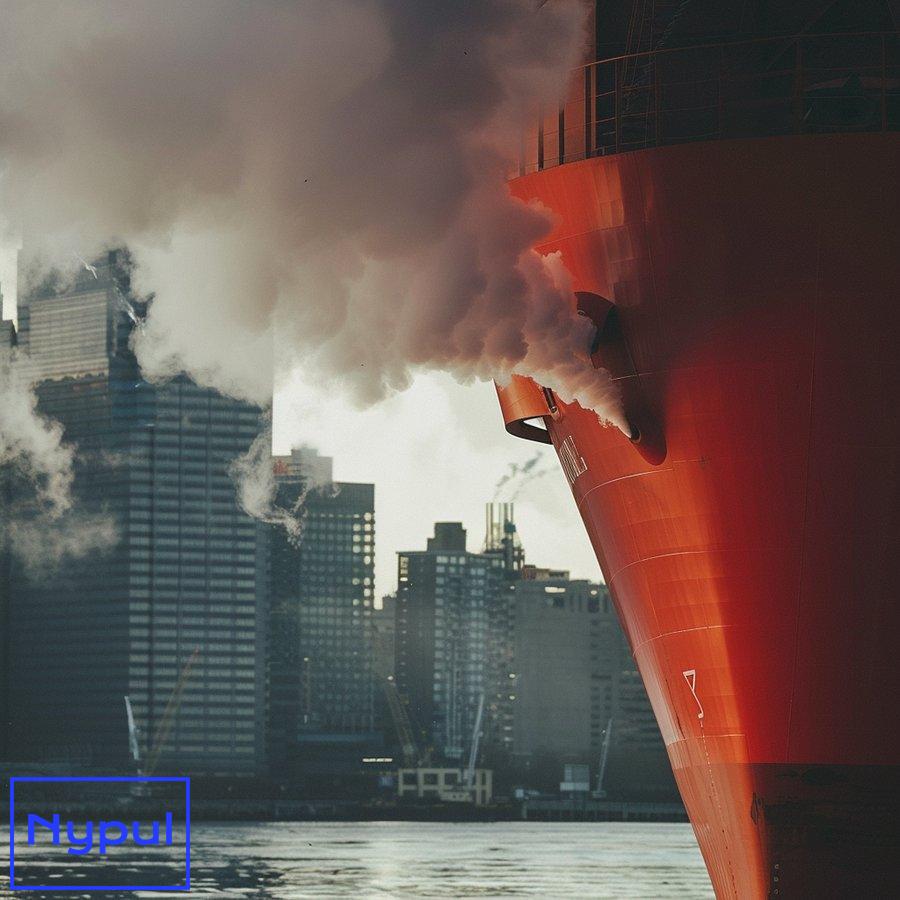
Maritime air pollution represents a significant global environmental and health concern. The shipping industry, while crucial for international trade and economic growth, contributes substantially to air pollution, particularly in coastal areas and port cities.
Global emissions from maritime transport
The International Maritime Organization (IMO) estimates that ships are responsible for approximately 2.5% of global greenhouse gas emissions. This percentage may seem small, but it translates to a substantial volume of pollutants released into the atmosphere annually. In absolute terms, the maritime sector emits around 940 million tonnes of CO2 each year.
Beyond greenhouse gases, ships also release other harmful pollutants:
Sulfur oxides (SOx): Ships emit approximately 9 million tonnes of SOx annually, accounting for about 13% of total global SOx emissions.
Nitrogen oxides (NOx): Maritime transport contributes around 18-30% of global NOx emissions, with an estimated 20 million tonnes released yearly.
Particulate matter (PM): Ships release about 1.4 million tonnes of PM10 and 1.3 million tonnes of PM2.5 annually.
To put these figures into perspective, let’s compare maritime emissions to those from other transport sectors:
| Transport Sector | CO2 Emissions (million tonnes/year) | % of Global Transport Emissions |
|---|---|---|
| Road | 5,800 | 74.5% |
| Aviation | 918 | 11.8% |
| Maritime | 940 | 12.1% |
| Rail | 125 | 1.6% |
Regional impact of maritime air pollution
The effects of maritime air pollution are not evenly distributed globally. Coastal regions and major port cities bear the brunt of these emissions due to the concentration of shipping activities in these areas.
European coastal regions: In Europe, ship emissions contribute to about 50% of air pollution in coastal areas. The Mediterranean Sea, in particular, experiences high levels of maritime pollution due to its heavy shipping traffic and enclosed nature.
Asian port cities: Major Asian ports like Singapore, Hong Kong, and Shanghai face significant air quality challenges due to intense maritime activities. In Hong Kong, for instance, ship emissions account for about 50% of the city’s total SOx emissions.
North American coastal areas: The ports of Los Angeles and Long Beach in California collectively form one of the busiest port complexes in the United States. Before the implementation of stricter regulations, these ports contributed to about 25% of the region’s diesel particulate matter emissions.
Health impacts of maritime air pollution
The scale of maritime air pollution becomes even more apparent when considering its health impacts. A study published in Nature Communications estimated that ship-related PM2.5 emissions lead to approximately 60,000 premature deaths globally each year, with the highest mortality rates in East Asia, South Asia, and Europe.
Coastal communities near major shipping routes and ports are particularly vulnerable. For example:
Respiratory issues: Increased rates of asthma, bronchitis, and other respiratory diseases are observed in populations living near major ports.
Cardiovascular problems: Long-term exposure to maritime air pollution has been linked to higher incidences of heart disease and stroke.
Cancer risk: Some studies suggest an elevated risk of lung cancer in areas with high shipping-related air pollution.
The economic cost of these health impacts is substantial. The International Council on Clean Transportation (ICCT) estimates that the health-related costs of ship emissions amount to approximately $150 billion annually worldwide.
Environmental impacts
Beyond human health, maritime air pollution significantly affects the environment:
Ocean acidification: SOx emissions contribute to acid rain and ocean acidification, threatening marine ecosystems.
Climate change: CO2 and black carbon emissions from ships contribute to global warming and climate change.
Eutrophication: NOx emissions can lead to excessive nutrient enrichment in coastal waters, causing algal blooms and oxygen depletion.
In conclusion, the scale of maritime air pollution is vast and multifaceted. It encompasses not only the volume of emissions but also their wide-ranging impacts on human health, air quality, and the environment. As global trade continues to grow, addressing this pollution source becomes increasingly crucial for protecting both human and environmental health.
Which major air pollutants are emitted by ships and ports?
Ships and ports emit a variety of air pollutants that significantly impact air quality, human health, and the environment. Understanding these pollutants, their sources, and their effects is crucial for developing effective mitigation strategies.
Carbon dioxide (CO2)
CO2 is the primary greenhouse gas emitted by ships and ports. It’s produced through the combustion of fossil fuels in ship engines and port equipment.
Sources: Main and auxiliary engines of ships, boilers, port vehicles, and equipment.
Effects: CO2 is a major contributor to global warming and climate change. While not directly harmful to human health, its environmental impacts indirectly affect human well-being through climate-related events and long-term environmental changes.
Sulfur oxides (SOx)
SOx, primarily sulfur dioxide (SO2), are formed when sulfur-containing fuels are burned.
Sources: Primarily from the combustion of high-sulfur marine fuels in ship engines.
Effects: SOx contributes to acid rain, which can damage buildings, crops, and ecosystems. It also forms sulfate particles, a component of particulate matter, which can cause respiratory problems when inhaled.
Nitrogen oxides (NOx)
NOx are formed when nitrogen and oxygen react at high temperatures during fuel combustion.
Sources: Ship engines, especially during high-temperature combustion processes. Port equipment and vehicles also contribute.
Effects: NOx can cause respiratory irritation and contribute to the formation of smog and acid rain. It also plays a role in the formation of ground-level ozone, a major component of urban air pollution.
Particulate matter (PM)
PM includes a mixture of solid particles and liquid droplets found in the air. PM is categorized based on size, with PM10 (particles less than 10 micrometers in diameter) and PM2.5 (particles less than 2.5 micrometers) being of particular concern.
Sources: Formed from the combustion of fossil fuels in ship engines and port equipment. It can also be created secondarily in the atmosphere from other pollutants like SOx and NOx.
Effects: PM can penetrate deep into the lungs and even enter the bloodstream, causing respiratory and cardiovascular problems. Long-term exposure is associated with increased risk of lung cancer and heart disease.
Black carbon (BC)
BC is a component of PM and is formed by the incomplete combustion of fossil fuels, biofuels, and biomass.
Sources: Primarily from the combustion of marine diesel in ship engines, especially during low-efficiency operating conditions.
Effects: BC is a potent climate forcer, absorbing sunlight and warming the atmosphere. It also contributes to health problems associated with PM exposure.
Volatile organic compounds (VOCs)
VOCs are a group of chemicals that easily evaporate at room temperature.
Sources: Fuel storage and transfer operations in ports, ship painting and maintenance activities, and incomplete fuel combustion.
Effects: VOCs contribute to the formation of ground-level ozone and can cause various health effects, including eye, nose, and throat irritation, headaches, and damage to the liver, kidney, and central nervous system.
Carbon monoxide (CO)
CO is produced by the incomplete combustion of carbon-containing fuels.
Sources: Ship engines, especially during low-efficiency operations, and port vehicles and equipment.
Effects: CO can cause headaches, dizziness, and nausea at low levels. At high levels, it can be fatal by reducing oxygen delivery to the body’s organs and tissues.
To illustrate the relative contributions of these pollutants from maritime sources, consider the following table:
| Pollutant | Global Maritime Contribution | Primary Sources in Maritime Sector |
|---|---|---|
| CO2 | ~2.5% of global emissions | Ship engines, port equipment |
| SOx | ~13% of global emissions | High-sulfur marine fuels |
| NOx | 18-30% of global emissions | Ship engines, port equipment |
| PM2.5 | ~1.2% of global emissions | Fuel combustion, secondary formation |
| BC | ~2% of global emissions | Marine diesel combustion |
| VOCs | ~1% of global emissions | Fuel storage, ship maintenance |
Ozone (O3)
While not directly emitted, ozone is formed in the atmosphere through reactions involving NOx and VOCs in the presence of sunlight.
Sources: Created through chemical reactions of NOx and VOCs emitted by ships and port activities.
Effects: Ground-level ozone can cause respiratory problems, trigger asthma attacks, and damage vegetation.
Heavy metals
Trace amounts of heavy metals can be present in ship emissions.
Sources: Fuel impurities and engine wear.
Effects: Some heavy metals can be toxic even in small quantities, potentially causing neurological and developmental problems.
Understanding these pollutants and their sources is crucial for developing targeted emission reduction strategies. For instance, the IMO’s 2020 global sulfur cap primarily addresses SOx emissions, while NOx emissions are targeted through engine design standards. Comprehensive approaches that address multiple pollutants simultaneously, such as shifting to cleaner fuels or implementing shore power, can provide broader air quality benefits.
The complex nature of these pollutants and their interactions in the atmosphere underscores the need for continued research and monitoring. As regulations evolve and new technologies emerge, the maritime industry faces the ongoing challenge of balancing operational efficiency with environmental responsibility to mitigate the impacts of these harmful emissions.
How do different sources in port areas contribute to emissions?
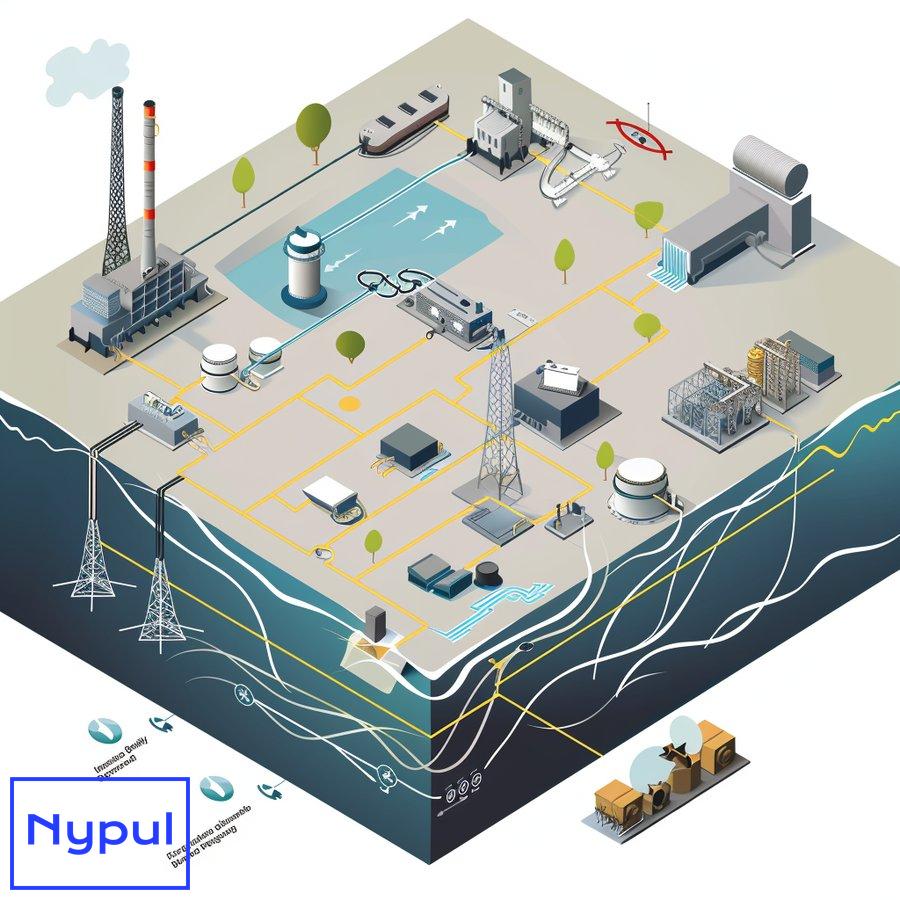
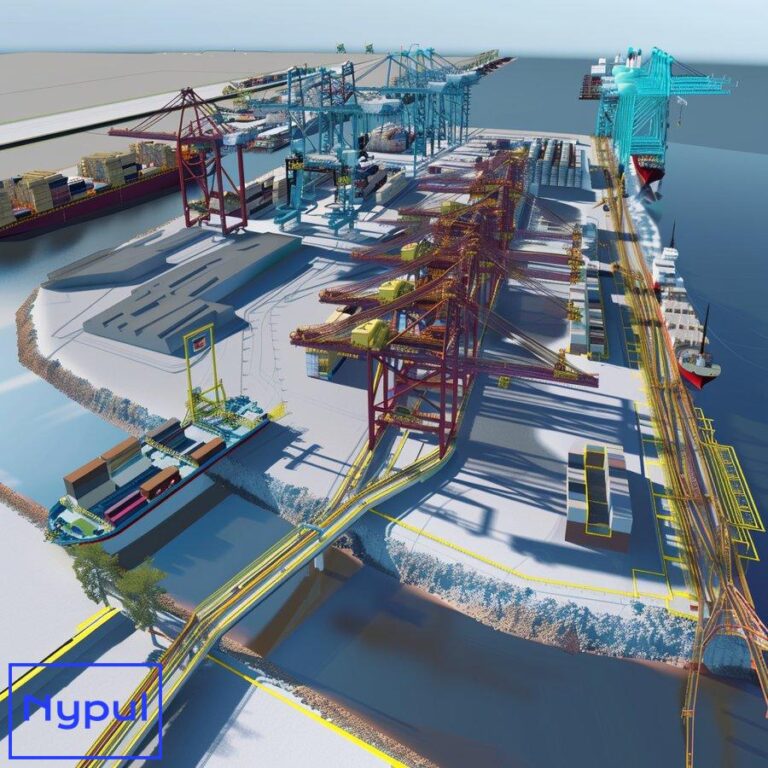
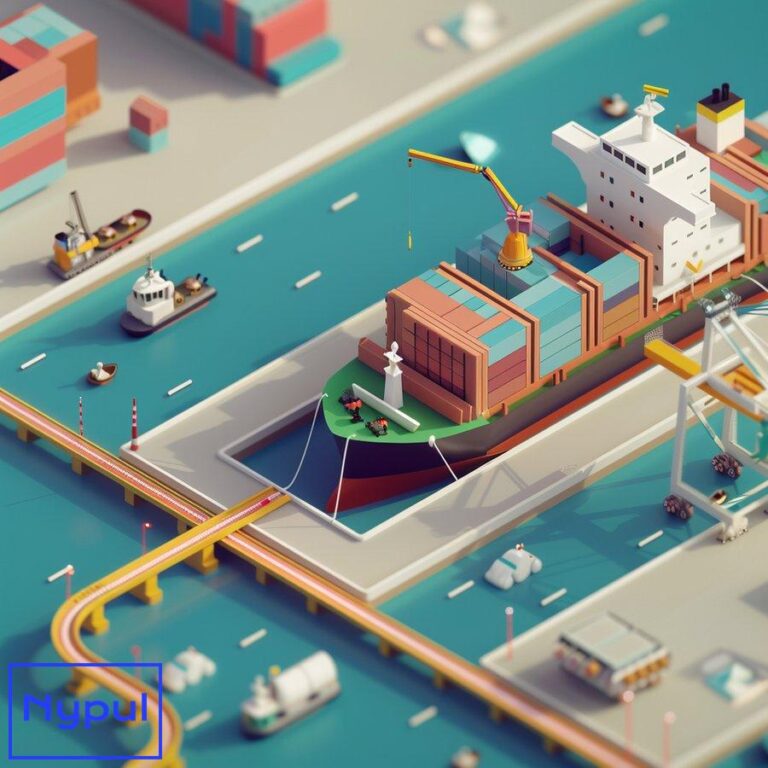
Port areas are complex environments with multiple emission sources contributing to overall air pollution. Understanding these sources and their relative contributions is crucial for developing effective emission reduction strategies. Let’s explore the main emission sources in port areas and their impacts.
Ocean-going vessels (OGVs)
Ocean-going vessels are typically the largest contributors to port-related emissions.
Main engines: Used for propulsion when the ship is at sea and maneuvering in port.
– Contribute significantly to NOx, SOx, and PM emissions.
– Emissions vary based on engine type, fuel used, and operational mode.
Auxiliary engines: Provide electricity for onboard systems when the main engine is not running.
– Major source of emissions during hotelling (when ships are docked).
– Contribute to CO2, NOx, SOx, and PM emissions.
Boilers: Used for heating fuel and providing hot water and steam.
– Contribute to SOx and PM emissions, especially when using high-sulfur fuels.
Harbor craft
Harbor craft include tugboats, ferries, pilot boats, and other vessels that operate within the port area.
Tugboats: Used to assist large ships in maneuvering.
– High-power engines contribute significantly to NOx and PM emissions.
– Frequent use results in continuous emissions throughout port operations.
Ferries: Provide passenger and vehicle transport within the port area.
– Regular schedules lead to consistent emission patterns.
– Contribute to NOx, PM, and CO2 emissions.
Cargo handling equipment (CHE)
CHE includes various vehicles and machinery used to move cargo within the port.
Cranes: Used for loading and unloading containers and bulk cargo.
– Electric cranes have lower direct emissions but contribute to indirect emissions through electricity generation.
– Diesel-powered cranes contribute to NOx and PM emissions.
Yard tractors and forklifts: Move cargo around the port area.
– Frequent use and older diesel engines can lead to significant NOx and PM emissions.
Trucks and rail
These modes of transport move cargo to and from the port.
Drayage trucks: Short-haul trucks that transport containers within and around the port area.
– Often older vehicles with higher emission rates.
– Major contributors to NOx and PM emissions, especially during idling and low-speed operations.
Locomotives: Used for moving cargo by rail.
– Contribute to NOx and PM emissions, particularly older models.
– Emissions vary based on the type of locomotive (e.g., switch engines vs. line-haul engines).
To illustrate the relative contributions of these sources, consider the following table based on a typical large container port:
| Emission Source | NOx (%) | PM2.5 (%) | SOx (%) | CO2 (%) |
|---|---|---|---|---|
| Ocean-going vessels | 50-60 | 40-50 | 80-90 | 30-40 |
| Harbor craft | 15-25 | 20-30 | 5-10 | 10-15 |
| Cargo handling equipment | 10-15 | 10-15 | 1-3 | 15-20 |
| Trucks | 10-15 | 10-15 | 1-2 | 20-25 |
| Rail | 2-5 | 2-5 | <1 | 5-10 |
Note: These percentages are approximate and can vary significantly between ports based on their specific operations and local regulations.
Stationary sources
While often overlooked, stationary sources within ports can contribute to overall emissions.
Fuel storage tanks: Contribute to VOC emissions through evaporation.
Power plants: Some ports have on-site power generation facilities.
– Contribute to NOx, SOx, and PM emissions, depending on the fuel used.
Dust from bulk cargo handling: Loading and unloading of dry bulk cargo (e.g., coal, grain) can release particulate matter.
Factors influencing emission contributions
Several factors can affect the relative contributions of these sources:
Port size and type: Larger ports and those handling more containerized cargo tend to have higher emissions from OGVs and CHE.
Geographic location: Ports in areas with stricter environmental regulations may have lower overall emissions or different emission profiles.
Operational efficiency: Ports with more efficient operations (e.g., faster turnaround times, reduced idling) may have lower emissions per unit of cargo handled.
Fuel types and quality: The use of low-sulfur fuels or alternative fuels can significantly reduce certain emissions, particularly SOx.
Age and condition of equipment: Older vehicles and equipment generally have higher emission rates.
Seasonal variations: Some ports experience significant seasonal changes in cargo volumes, affecting emission patterns.
Understanding these diverse emission sources and their relative contributions is essential for developing targeted and effective emission reduction strategies. Ports can prioritize interventions based on the most significant local sources of pollution. For example:
- Implementing shore power (cold ironing) to reduce emissions from OGVs during hotelling.
- Upgrading or replacing older cargo handling equipment with cleaner models.
- Improving traffic management to reduce truck idling and congestion.
- Encouraging the use of cleaner fuels or alternative propulsion systems for harbor craft.
By addressing emissions from multiple sources simultaneously, ports can achieve substantial improvements in local air quality while maintaining operational efficiency. However, it’s important to note that emission reduction efforts often require collaboration between various stakeholders, including port authorities, shipping companies, terminal operators, and local governments, to be truly effective.
What factors influence emission levels in maritime operations?
Emission levels in maritime operations are influenced by a complex interplay of technological, operational, regulatory, and environmental factors. Understanding these factors is crucial for developing effective strategies to reduce emissions in the maritime sector.

Vessel characteristics
The physical and technical attributes of ships play a significant role in determining their emission profiles.
Engine type and age: Older engines generally have higher emission rates. Different engine types (e.g., slow-speed, medium-speed, high-speed diesel engines) have varying emission characteristics.
Vessel size: Larger vessels typically consume more fuel and produce more emissions in absolute terms, but they may be more efficient per unit of cargo transported.
Hull design and condition: A well-designed and maintained hull reduces water resistance, improving fuel efficiency and reducing emissions.
Propulsion system: The choice between conventional propellers, azimuth thrusters, or more advanced systems like hybrid propulsion can affect fuel consumption and emissions.
Fuel type and quality
The type and quality of fuel used have a direct impact on emissions, particularly for sulfur oxides (SOx) and particulate matter (PM).
Heavy fuel oil (HFO): Traditionally used due to its low cost, but high in sulfur content.
Marine gas oil (MGO) and marine diesel oil (MDO): Lower in sulfur compared to HFO, resulting in reduced SOx emissions.
Liquefied natural gas (LNG): Produces lower SOx and PM emissions but may increase methane emissions.
Alternative fuels: Biofuels, hydrogen, and ammonia are being explored as low-carbon alternatives.
The following table illustrates the typical emission factors for different fuel types:
| Fuel Type | CO2 (g/kWh) | NOx (g/kWh) | SOx (g/kWh) | PM (g/kWh) |
|---|---|---|---|---|
| HFO (2.7% S) | 620-630 | 14-18 | 10-12 | 1.5-2.0 |
| MGO (0.1% S) | 580-600 | 8-11 | 0.4-0.5 | 0.25-0.35 |
| LNG | 430-470 | 1-2 | ~0 | 0.02-0.04 |
Operational factors
How ships are operated significantly influences their emission levels.
Speed: Operating at lower speeds (slow steaming) can substantially reduce fuel consumption and emissions.
Load factor: Ships operating at optimal load factors are generally more fuel-efficient.
Route optimization: Choosing the most efficient routes considering weather conditions and currents can reduce fuel consumption.
Time in port: Longer port stays increase emissions from auxiliary engines unless shore power is used.
Maintenance practices: Regular maintenance of engines, hull, and propellers ensures optimal performance and lower emissions.
Environmental conditions
External environmental factors can affect a ship’s performance and, consequently, its emissions.
Weather conditions: Strong headwinds and rough seas increase fuel consumption and emissions.
Water depth and currents: Shallow waters and strong currents can increase resistance and fuel consumption.
Temperature: Ambient temperature affects engine efficiency and the use of auxiliary systems (e.g., air conditioning).
Regulatory environment
Regulations play a crucial role in shaping emission levels in the maritime industry.
IMO sulfur cap: The global 0.5% sulfur limit implemented in 2020 has significantly reduced SOx emissions.
Emission Control Areas (ECAs): Stricter emission limits in designated areas have led to the use of cleaner fuels or abatement technologies in these regions.
Energy Efficiency Design Index (EEDI): Mandatory for new ships, encouraging more energy-efficient designs.
Carbon Intensity Indicator (CII): Operational efficiency rating system encouraging ongoing emission reductions.
Regional and local regulations: Some ports and countries impose additional emission requirements.
Technological solutions
Various technologies can be employed to reduce emissions:
Scrubbers: Remove SOx from exhaust gases, allowing the use of higher-sulfur fuels.
Selective Catalytic Reduction (SCR): Reduces NOx emissions.
Exhaust Gas Recirculation (EGR): Another method for NOx reduction.
Shore power: Allows ships to use land-based electricity while at berth, eliminating emissions from auxiliary engines.
Energy efficiency technologies: Include waste heat recovery systems, LED lighting, and advanced hull coatings.
Market and economic factors
Economic considerations significantly influence decisions that affect emissions.
Fuel prices: Higher fuel prices incentivize efficiency measures and the adoption of alternative fuels.
Carbon pricing: Emerging carbon pricing mechanisms may encourage emission reductions.
Investment costs: The high cost of new technologies or ship replacements can slow the adoption of cleaner solutions.
Charter agreements: The structure of charter agreements can affect incentives for efficiency improvements.
Awareness and expertise
The human factor plays a crucial role in emission management.
Crew training: Well-trained crews can operate ships more efficiently.
Company policies: Strong corporate commitments to sustainability can drive emission reduction efforts.
Industry collaboration: Sharing best practices and joint research efforts can accelerate emission reductions across the sector.
Understanding these factors and their interrelationships is essential for developing comprehensive strategies to reduce maritime emissions. Effective approaches often require a combination of technological innovations, operational improvements, regulatory compliance, and economic incentives. As the industry continues to evolve, new factors may emerge, and the relative importance of existing factors may shift, necessitating ongoing adaptation of emission reduction strategies.
How do regulatory measures aim to reduce ship and port emissions?
Regulatory measures play a crucial role in reducing ship and port emissions by setting standards, imposing limits, and creating incentives for cleaner operations. These regulations are implemented at various levels – international, regional, national, and local – forming a complex framework aimed at mitigating the environmental impact of maritime activities.
International Maritime Organization (IMO) regulations
The IMO, a specialized agency of the United Nations, is the primary body responsible for setting global standards for maritime safety, security, and environmental performance.
MARPOL Annex VI: This is the main international convention addressing air pollution from ships.
Global sulfur cap: Limits the sulfur content in marine fuels to 0.5% m/m (mass by mass) since January 1, 2020, down from the previous 3.5% limit.
– Aims to reduce SOx emissions by approximately 77% compared to pre-2020 levels.
– Ships can comply by using low-sulfur fuels, alternative fuels like LNG, or installing exhaust gas cleaning systems (scrubbers).
NOx emission standards: Sets limits on NOx emissions from marine diesel engines.
– Tier I (2000): Applied to ships constructed on or after January 1, 2000.
– Tier II (2011): 20% reduction from Tier I, applicable to ships constructed on or after January 1, 2011.
– Tier III (2016): 80% reduction from Tier I, applicable in NOx Emission Control Areas (NECAs) for ships constructed on or after January 1, 2016.
Energy Efficiency Design Index (EEDI): Mandatory for new ships, requiring a minimum energy efficiency level per capacity mile.
– Aims to promote the use of more energy-efficient equipment and engines.
– The required EEDI is tightened incrementally every five years.
Ship Energy Efficiency Management Plan (SEEMP): Mandatory operational measure that establishes a mechanism to improve the energy efficiency of a ship in a cost-effective manner.
Carbon Intensity Indicator (CII): Operational measure that rates ships based on their carbon intensity, with increasingly stringent requirements over time.
– Applies to all cargo, RoPax and cruise ships above 5,000 GT.
– Ships rated E (lowest) or D for three consecutive years must submit a corrective action plan.
Emission Control Areas (ECAs)
ECAs are designated sea areas where stricter emission controls are enforced.
Sulfur Emission Control Areas (SECAs): Limit sulfur content in fuel to 0.1% m/m.
– Current SECAs: Baltic Sea, North Sea, North American coastline, US Caribbean Sea area.
NOx Emission Control Areas (NECAs): Require Tier III NOx standards for new ships.
– Current NECAs: North American coastline, US Caribbean Sea area, Baltic Sea, North Sea.
European Union (EU) regulations
The EU has implemented additional measures to complement and, in some cases, go beyond IMO regulations.
EU Sulfur Directive: Limits sulfur content in marine fuels to 0.1% in EU ports and for passenger ships in EU waters.
EU Monitoring, Reporting and Verification (MRV) Regulation: Requires ships above 5,000 GT to monitor and report their CO2 emissions on voyages to, from, and between EU ports.
FuelEU Maritime Initiative: Proposed regulation to increase the use of sustainable alternative fuels in European shipping and ports.
– Sets limits on the greenhouse gas intensity of energy used onboard ships.
– Proposes requirements for use of shore-side electricity for certain ship types.
United States regulations
The US has implemented both federal and state-level regulations to address maritime emissions.
Environmental Protection Agency (EPA) standards: Align with IMO Tier III NOx standards for US-flagged vessels.
California Air Resources Board (CARB) regulations:
– Ocean-Going Vessel Fuel Regulation: Requires the use of 0.1% sulfur fuel within 24 nautical miles of the California coast.
– At-Berth Regulation: Requires vessels to reduce emissions while docked, typically by using shore power.
Port-specific regulations and initiatives
Many ports have implemented their own measures to reduce emissions:
Green port programs: Incentivize cleaner ships through reduced port fees or priority berthing.
– Examples: Port of Los Angeles/Long Beach Clean Air Action Plan, Port of Rotterdam’s Environmental Ship Index.
Shore power requirements: Mandating or incentivizing the use of shore-side electricity for ships at berth.
Clean truck programs: Regulating emissions from drayage trucks serving the port.
Speed reduction programs: Encouraging ships to reduce speed when approaching ports to lower emissions.
The following table summarizes key regulatory measures and their primary targets:
| Regulatory Measure | Primary Target | Implementing Body | Geographic Scope |
|---|---|---|---|
| Global Sulfur Cap | SOx | IMO | Global |
| NOx Tier Standards | NOx | IMO | Global/Regional (Tier III) |
| EEDI | CO2 | IMO | Global |
| SEEMP | CO2 | IMO | Global |
| CII | CO2 | IMO | Global |
| ECAs | SOx, NOx | IMO | Regional |
| EU MRV | CO2 | EU | EU waters |
| FuelEU Maritime | GHG intensity | EU | EU waters |
| EPA standards | NOx | US | US waters |
| CARB regulations | Various | California | California waters |
Challenges and considerations
While these regulatory measures have significantly contributed to reducing ship and port emissions, several challenges remain:
Enforcement: Ensuring compliance, especially on the high seas, can be challenging.
Technological limitations: Some ships, particularly older vessels, may struggle to meet new standards without significant retrofitting.
Economic impact: Compliance often requires substantial investments, which can be challenging for smaller operators.
Regulatory fragmentation: The variety of regulations at different levels can create complexity for international shipping.
Balancing priorities: Regulations must balance environmental goals with the need to maintain efficient global trade.
Addressing greenhouse gases: While progress has been made on local pollutants, reducing GHG emissions remains a significant challenge.
In conclusion, regulatory measures have been instrumental in driving reductions in ship and port emissions. The multi-layered approach, combining international, regional, and local regulations, provides a comprehensive framework for addressing various aspects of maritime emissions. As technology advances and environmental concerns grow, these regulations are likely to evolve, potentially becoming more stringent and comprehensive in the future. The maritime industry’s ability to adapt to these changing regulations will be crucial in achieving sustainable shipping practices and reducing the sector’s environmental impact.
What technological solutions are being implemented for cleaner shipping?
The maritime industry is actively implementing a range of technological solutions to achieve cleaner shipping. These innovations address various aspects of vessel design, propulsion systems, and operational practices to reduce emissions and improve overall environmental performance.
Alternative fuels and propulsion systems
One of the most significant areas of technological development is in alternative fuels and propulsion systems that aim to reduce or eliminate emissions from traditional fossil fuels.
Liquefied Natural Gas (LNG)
LNG has gained traction as a cleaner alternative to heavy fuel oil.
Advantages:
– Reduces SOx emissions by nearly 100%
– Lowers NOx emissions by up to 80%
– Cuts CO2 emissions by 20-30%
Challenges:
– Requires significant infrastructure investment
– Potential for methane slip (unburned methane emissions)
– Still a fossil fuel, not a long-term solution for decarbonization
Implementation: Several major shipping companies, including CMA CGM and Hapag-Lloyd, have invested in LNG-powered container ships.
Hydrogen and Fuel Cells
Hydrogen, particularly when produced from renewable sources, offers a zero-emission option for shipping.
Advantages:
– Zero emissions at point of use
– High energy density by weight
Challenges:
– Low energy density by volume, requiring large storage tanks
– High production and storage costs
– Lack of widespread infrastructure
Implementation: Several pilot projects are underway, including the HySeas III project developing a hydrogen-powered ferry in Scotland.
Battery-Electric Propulsion
Battery technology is advancing, making electric propulsion viable for short-sea shipping and port operations.
Advantages:
– Zero emissions during operation
– Reduced noise pollution
– Lower maintenance requirements
Challenges:
– Limited range due to battery capacity
– Long charging times
– High initial investment costs
Implementation: Norway has been a leader in electric ferries, with vessels like the Ampere demonstrating the viability of battery-powered short-sea shipping.
Ammonia
Ammonia is being explored as a potential zero-carbon fuel for long-distance shipping.
Advantages:
– No carbon emissions when burned
– Easier to store than hydrogen
– Existing infrastructure can be adapted
Challenges:
– Toxic and corrosive nature requires careful handling
– Lower energy density than conventional fuels
– Currently produced mainly from fossil fuels
Implementation: MAN Energy Solutions is developing an ammonia-fueled engine for large container ships, with commercial availability expected by 2024.
Biofuels
Biofuels derived from renewable sources offer a drop-in solution for existing engines.
Advantages:
– Can be used in existing engines with minimal modifications
– Potential for significant lifecycle CO2 reductions
Challenges:
– Limited availability and high costs
– Concerns about sustainability and competition with food production
Implementation: Maersk has been testing biofuels in some of its vessels, aiming to offer carbon-neutral shipping options.
Emission reduction technologies
In addition to alternative fuels, various technologies are being implemented to reduce emissions from existing and new vessels.
Exhaust Gas Cleaning Systems (Scrubbers)
Scrubbers remove sulfur oxides from ship exhaust gases, allowing the use of higher-sulfur fuels while complying with emission regulations.
Types:
– Open-loop: Use seawater to wash exhaust gases
– Closed-loop: Use freshwater with added chemicals, treating and recirculating the wash water
– Hybrid: Can switch between open and closed-loop operation
Advantages:
– Allows continued use of cheaper high-sulfur fuels
– Can remove up to 99% of sulfur oxides
Challenges:
– High installation costs
– Concerns about environmental impact of wash water discharge (for open-loop systems)
Implementation: As of 2021, over 4,000 ships globally had scrubbers installed or on order.
Selective Catalytic Reduction (SCR)
SCR systems reduce NOx emissions by treating exhaust gases with a catalyst and a reducing agent, typically urea.
Advantages:
– Can reduce NOx emissions by up to 90%
– Allows compliance with Tier III NOx standards
Challenges:
– Requires storage and handling of urea solution
– Less effective at lower engine loads
Implementation: Widely adopted on newer vessels, especially those operating in NOx Emission Control Areas.
Energy Efficiency Technologies
Various technologies are being implemented to improve overall vessel energy efficiency:
Hull design and coatings:
– Advanced hull forms to reduce water resistance
– Air lubrication systems to reduce friction
– Fouling-resistant hull coatings to maintain efficiency over time
Waste heat recovery systems:
– Capture waste heat from engine exhaust to generate additional power
– Can improve overall energy efficiency by 5-10%
Wind-assisted propulsion:
– Modern interpretations of sails, such as rotor sails or wing sails
– Can reduce fuel consumption by 5-20% depending on routes and conditions
Solar panels:
– Supplement power for auxiliary systems
– Most effective on ships with large deck areas, like car carriers
The following table summarizes some key technological solutions and their primary benefits:
| Technology | Primary Benefit | Emission Reduction Potential | Implementation Challenges |
|---|---|---|---|
| LNG propulsion | SOx, NOx reduction | 20-30% CO2, 80% NOx, 99% SOx | Infrastructure, methane slip |
| Hydrogen fuel cells | Zero emissions | 100% all emissions | Cost, storage, infrastructure |
| Battery-electric | Zero emissions | 100% all emissions | Range limitation, charging time |
| Ammonia | Zero carbon | 100% CO2 | Toxicity, energy density |
| Biofuels | CO2 reduction | Up to 80% lifecycle CO2 | Availability, cost |
| Scrubbers | SOx reduction | Up to 99% SOx | Cost, wash water concerns |
| SCR | NOx reduction | Up to 90% NOx | Urea handling, low-load efficiency |
| Hull optimization | Fuel efficiency | 5-15% all emissions | Design complexity |
| Wind assistance | Fuel reduction | 5-20% all emissions | Route dependency |
Digital and operational solutions
Technological advancements are not limited to hardware; software and operational technologies also play a crucial role in reducingemissions:
Route optimization software:
– Uses real-time weather data and machine learning to determine the most fuel-efficient routes
– Can reduce fuel consumption and emissions by 3-5%
Just-in-time arrival systems:
– Coordinate ship speeds with port availability to reduce waiting times and unnecessary fuel consumption
– Potential to reduce emissions in port areas by 20-30%
Digital twins:
– Virtual replicas of ships that can optimize performance and predict maintenance needs
– Can improve overall efficiency by 10-15% through better operation and maintenance
Autonomous and remote-controlled ships:
– Reduce human error and optimize operations
– Still in early stages of development and testing
The implementation of these technological solutions faces several challenges:
Cost: Many of these technologies require significant upfront investment, which can be challenging for smaller operators.
Regulatory uncertainty: Evolving regulations can make long-term technology investments risky.
Infrastructure: New fuels and technologies often require significant shoreside infrastructure development.
Technical maturity: Some solutions, particularly in alternative fuels, are still in early stages of development.
Retrofit complexity: Implementing new technologies on existing ships can be technically challenging and expensive.
Despite these challenges, the maritime industry is making significant strides in adopting cleaner technologies. The combination of regulatory pressure, environmental concerns, and potential long-term cost savings is driving innovation and implementation across the sector. As these technologies mature and become more widely adopted, they have the potential to dramatically reduce the environmental impact of shipping, contributing to global efforts to combat climate change and improve air quality in coastal areas and port cities.
How can ports improve their operations to reduce air pollution?
Ports play a crucial role in the global supply chain and are significant contributors to local air pollution. Improving port operations to reduce air pollution is essential for protecting public health and the environment in coastal communities. Here are key strategies and technologies that ports can implement to achieve cleaner operations:
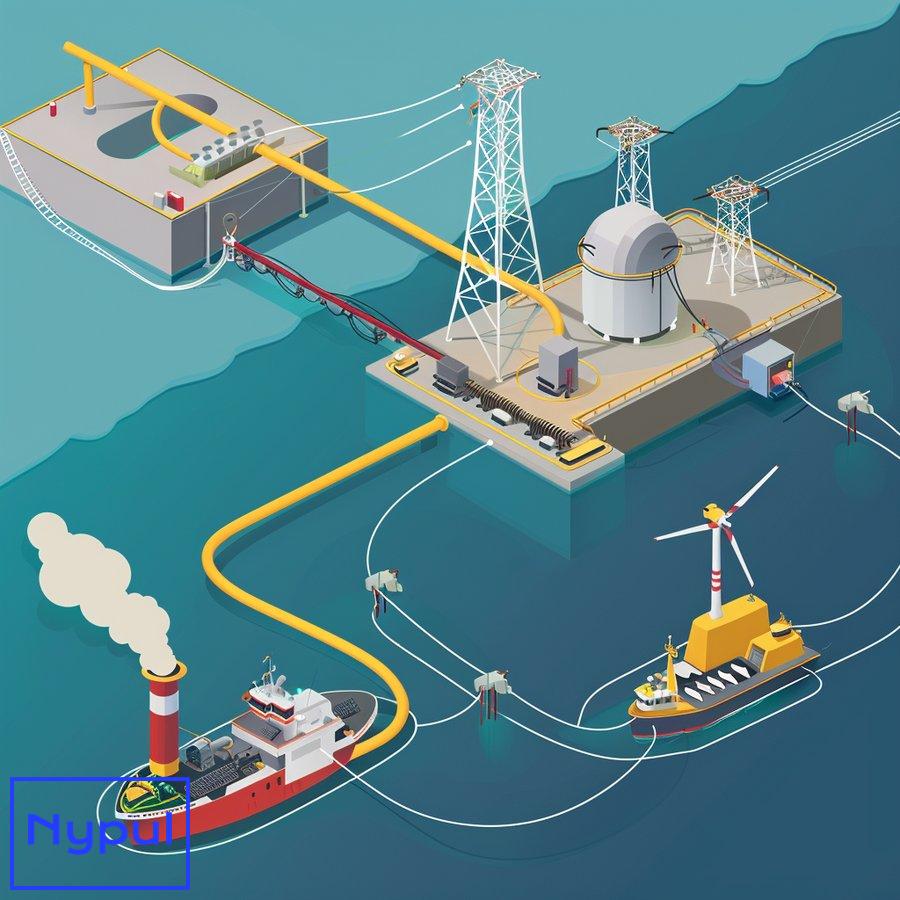
Shore power (Cold ironing)
Shore power allows ships to plug into the local electricity grid while at berth, eliminating emissions from auxiliary engines.
Benefits:
– Can reduce ship emissions at berth by up to 98%
– Improves local air quality and reduces noise pollution
Implementation challenges:
– High infrastructure costs for both ports and ships
– Requires standardization of power systems
– Local grid capacity may need upgrading
Success stories: The Port of Los Angeles has been a leader in shore power implementation, with all major container terminals equipped with the technology.
Clean truck programs
Modernizing the drayage truck fleet that serves the port can significantly reduce emissions.
Strategies:
– Implementing stricter emission standards for trucks entering the port
– Providing incentives for truck replacement or retrofitting
– Promoting the adoption of zero-emission trucks (battery-electric or hydrogen fuel cell)
Benefits:
– Reduces NOx and PM emissions from truck operations
– Improves air quality along freight corridors
Implementation challenges:
– High costs of new clean trucks
– Need for charging/fueling infrastructure
– Potential resistance from truck owners
Example: The Clean Trucks Program at the Ports of Los Angeles and Long Beach has significantly reduced truck emissions since its implementation in 2008.
Cargo handling equipment electrification
Replacing diesel-powered cargo handling equipment with electric alternatives can substantially reduce local emissions.
Equipment types:
– Yard tractors
– Rubber-tyred gantry cranes
– Forklifts
– Top handlers
Benefits:
– Eliminates direct emissions from equipment operation
– Reduces noise pollution
– Lower maintenance costs in the long term
Challenges:
– High upfront costs
– Need for charging infrastructure
– Battery life and performance concerns
Case study: The Port of Long Beach has been testing electric yard tractors, demonstrating significant emission reductions and operational benefits.
Vessel speed reduction programs
Encouraging ships to reduce speed when approaching the port can lead to significant emission reductions.
Implementation methods:
– Voluntary programs with incentives
– Mandatory speed limits in port approach areas
Benefits:
– Reduces fuel consumption and emissions
– Can decrease the risk of whale strikes
Challenges:
– Potential impact on shipping schedules
– Need for coordination with shipping lines
Example: The Vessel Speed Reduction Program in the Santa Barbara Channel has achieved high participation rates and significant emission reductions.
Port equipment and vehicle upgrades
Upgrading port-owned vehicles and equipment to cleaner technologies can reduce overall port emissions.
Strategies:
– Replacing older vehicles with newer, cleaner models
– Retrofitting existing equipment with emission control technologies
– Adopting alternative fuels (e.g., biodiesel, renewable diesel)
Benefits:
– Immediate reduction in local pollutant emissions
– Improved air quality for port workers
Challenges:
– Budget constraints for equipment replacement
– Training requirements for new technologies
Green ship incentive programs
Offering financial incentives for cleaner ships can encourage the use of more environmentally friendly vessels.
Incentive types:
– Reduced port fees for ships with better environmental performance
– Priority berthing for cleaner vessels
Benefits:
– Encourages shipping lines to invest in cleaner technologies
– Improves overall port air quality
Challenges:
– Determining fair and effective incentive structures
– Verifying ship environmental performance
Example: The Port of Rotterdam’s Environmental Ship Index (ESI) program offers discounts on port fees for ships that exceed environmental standards.
Improved traffic management systems
Implementing advanced traffic management systems can reduce congestion and idle times, thereby lowering emissions.
Technologies:
– Automated gate systems
– Appointment systems for truck arrivals
– Real-time traffic monitoring and routing
Benefits:
– Reduces truck idling and congestion
– Improves overall port efficiency
Challenges:
– Integration with existing port systems
– Ensuring adoption by trucking companies
Case study: The Port of Hamburg’s smartPORT logistics system has significantly improved traffic flow and reduced waiting times.
Alternative fuels and infrastructure
Developing infrastructure for alternative fuels can support the transition to cleaner shipping.
Fuel types:
– Liquefied Natural Gas (LNG)
– Hydrogen
– Ammonia
– Biofuels
Benefits:
– Supports the adoption of cleaner fuels by ships
– Positions the port as a leader in sustainable shipping
Challenges:
– High infrastructure costs
– Uncertainty about future fuel adoption rates
Example: The Port of Rotterdam is developing infrastructure for various alternative fuels, including LNG and hydrogen.
Energy efficiency measures
Implementing energy efficiency measures across port operations can reduce overall energy consumption and emissions.
Strategies:
– LED lighting for port areas
– Energy-efficient buildings and facilities
– Renewable energy installations (e.g., solar panels, wind turbines)
Benefits:
– Reduces indirect emissions from electricity consumption
– Lowers operating costs in the long term
Challenges:
– Initial investment costs
– Integration with existing infrastructure
To illustrate the potential impact of these measures, consider the following table showing estimated emission reduction potentials:
| Measure | NOx Reduction | PM Reduction | CO2 Reduction |
|---|---|---|---|
| Shore power | 90-98% | 90-98% | Varies by grid mix |
| Clean truck program | 80-90% | 90-95% | 20-30% |
| Equipment electrification | 100% | 100% | Varies by grid mix |
| Vessel speed reduction | 10-30% | 10-30% | 10-30% |
| Green ship incentives | 20-40% | 20-40% | 10-20% |
| Traffic management | 10-20% | 10-20% | 10-20% |
Note: Actual reductions may vary based on specific implementation and local conditions.
Challenges in implementing port improvements
While these measures can significantly reduce air pollution, ports face several challenges in implementation:
Funding: Many improvements require substantial capital investment.
Stakeholder coordination: Ports must work with various stakeholders, including shipping lines, trucking companies, and local communities.
Regulatory compliance: Ensuring that improvements meet current and future regulatory requirements.
Operational disruption: Implementing new systems and technologies can temporarily disrupt port operations.
Technology maturity: Some clean technologies are still evolving and may have operational limitations.
Balancing priorities: Ports must balance environmental improvements with maintaining competitiveness and operational efficiency.
In conclusion, ports have a wide range of options to improve their operations and reduce air pollution. The most effective approach typically involves a combination of these strategies, tailored to the specific needs and circumstances of each port. By implementing these measures, ports can significantly reduce their environmental impact, improve public health in surrounding communities, and position themselves as leaders in sustainable maritime operations. As technology advances and regulations evolve, ports will need to continue adapting and innovating to meet the growing demand for cleaner, more sustainable shipping practices.
What challenges exist in implementing emission reduction strategies?
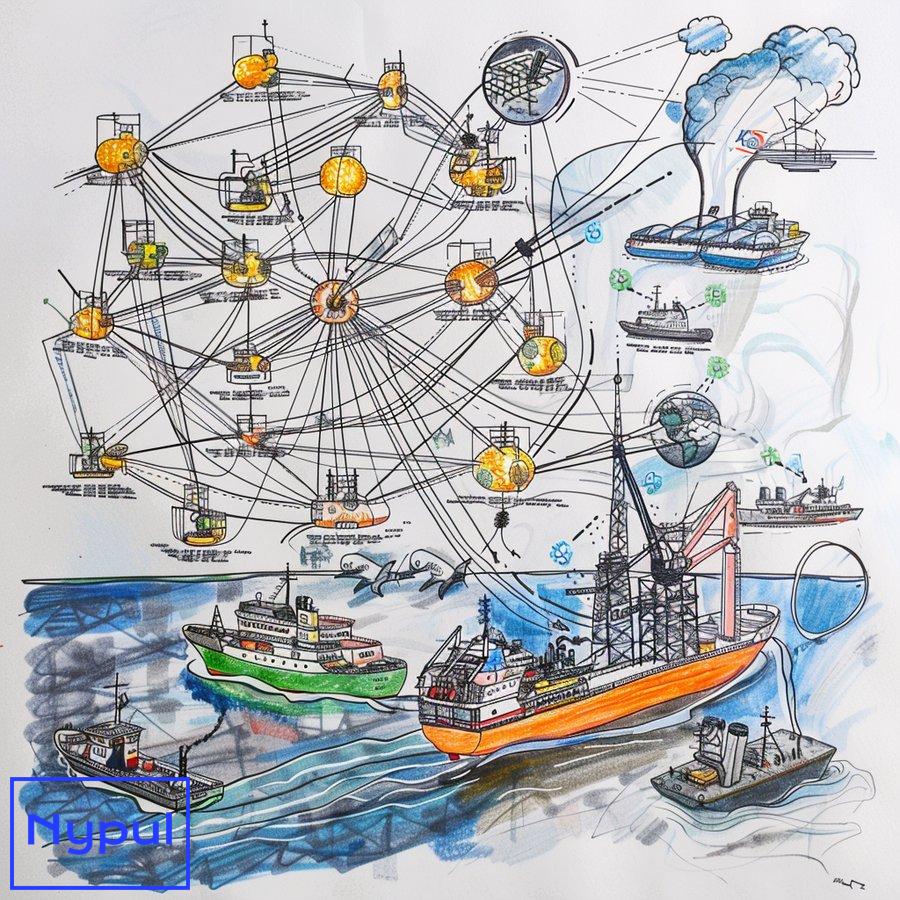
Implementing emission reduction strategies in the maritime industry faces numerous challenges that span technical, economic, regulatory, and operational domains. Understanding these challenges is crucial for developing effective solutions and policies to drive the industry towards cleaner operations.
Technical challenges
The maritime sector faces significant technical hurdles in adopting new emission reduction technologies:
Alternative fuel infrastructure:
– Developing and scaling infrastructure for alternative fuels like LNG, hydrogen, or ammonia requires substantial investment and coordination.
– Each fuel type needs specific storage, handling, and bunkering facilities, which may not be universally available.
Retrofitting existing vessels:
– Many emission reduction technologies are difficult or expensive to retrofit onto existing ships.
– Space constraints on older vessels can make installations of new systems challenging.
Energy density of alternative fuels:
– Many low-emission fuels have lower energy density than traditional marine fuels, requiring larger fuel storage areas and potentially reducing cargo capacity.
Technology maturity:
– Some promising technologies, like fuel cells for large vessels, are not yet mature enough for widespread commercial deployment.
– Reliability and performance of new technologies in harsh marine environments need to be proven.
Compatibility issues:
– Ensuring compatibility between new technologies and existing ship systems can be complex.
– Standardization of new technologies across the industry is often lacking.
Economic challenges
The financial aspects of implementing emission reduction strategies pose significant barriers:
High upfront costs:
– Many clean technologies require substantial initial investments.
– For example, installing a scrubber system can cost $2-10 million per vessel, depending on size and type.
Uncertain return on investment (ROI):
– The long-term economic benefits of some emission reduction technologies are not always clear, especially given fluctuating fuel prices.
– Payback periods can be long, which is challenging in an industry with tight profit margins.
Split incentives:
– In many cases, the entity investing in emission reduction technology (e.g., ship owner) is not the one benefiting from reduced fuel costs (e.g., charterer).
Market volatility:
– Fluctuations in shipping rates and fuel prices can make long-term investments in emission reduction technologies risky.
Competitive pressures:
– Companies fear losing competitive edge if they invest heavily in emission reduction while competitors do not.
The following table illustrates the estimated costs and potential fuel savings for various emission reduction technologies:
| Technology | Estimated Cost (USD) | Potential Annual Fuel Savings |
|---|---|---|
| LNG engine conversion | 15-22 million | 20-30% |
| Scrubber installation | 2-10 million | Allows use of cheaper high-sulfur fuel |
| Wind assist technology | 2-3 million | 5-20% |
| Hull coating | 0.5-1 million | 3-8% |
| Route optimization software | 50,000-200,000 | 3-5% |
Note: Costs and savings can vary significantly based on vessel size, type, and operational profile.
Regulatory challenges
The regulatory landscape presents its own set of challenges:
Regulatory uncertainty:
– Uncertainty about future regulations makes long-term investment decisions difficult.
– Rapidly evolving regulations can render recent investments obsolete.
Inconsistent global standards:
– Varying regulations across different regions create complexity for international shipping.
– For example, China has different sulfur limits in its domestic ECAs compared to international standards.
Enforcement difficulties:
– Ensuring compliance with emissions regulations, especially on the high seas, is challenging.
– Methods for accurately measuring ship emissions in real-time are still developing.
Conflicting regulations:
– Sometimes, regulations aimed at one environmental issue can conflict with others.
– For example, certain NOx reduction technologies can increase fuel consumption and CO2 emissions.
Slow regulatory process:
– The international nature of shipping means that new regulations often take years to develop and implement.
– This slow pace can lag behind technological advancements and urgent environmental needs.
Operational challenges
Implementing emission reduction strategies can significantly impact day-to-day ship operations:
Crew training:
– New technologies and fuels require specialized training for crew members.
– This training can be time-consuming and expensive, especially given the global nature of maritime workforce.
Operational disruptions:
– Installing new technologies often requires ships to be out of service for extended periods.
– Changes in operational practices (e.g., slow steaming) can disrupt established schedules and logistics chains.
Fuel availability:
– The global availability of alternative fuels is limited, which can restrict ship routing options.
– LNG, for instance, is not available at all ports, which can complicate voyage planning.
Safety concerns:
– Some alternative fuels, like hydrogen and ammonia, pose new safety risks that need to be carefully managed.
– New procedures and safety equipment are often required.
Performance variability:
– The effectiveness of some technologies (e.g., wind-assisted propulsion) can vary greatly depending on routes and weather conditions.
Market and industry challenges
The structure and nature of the maritime industry itself present challenges:
Industry fragmentation:
– The shipping industry is highly fragmented, with many small to medium-sized operators.
– This fragmentation makes industry-wide adoption of new technologies and practices difficult.
Long asset lifecycles:
– Ships typically have operational lives of 20-30 years, slowing the adoption of new technologies.
– This long lifecycle can lock in emissions patterns for decades.
Resistance to change:
– The maritime industry has traditionally been conservative, which can slow the adoption of new technologies.
– Concerns about reliability and performance of new systems in the harsh marine environment contribute to this resistance.
Limited R&D investment:
– Compared to other transport sectors, the maritime industry has historically invested less in R&D.
– This underinvestment can slow the development and adoption of innovative emission reduction technologies.
Global supply chain pressures:
– Demands for fast and cheap shipping can conflict with emission reduction goals.
– Just-in-time logistics systems can make it challenging to implement practices like slow steaming.
Stakeholder alignment:
– Aligning the interests of various stakeholders (ship owners, operators, cargo owners, ports) is challenging.
– Each stakeholder may have different priorities and incentives regarding emission reduction.
To illustrate the complexity of these challenges, consider the following scenario analysis for a shipping company considering different emission reduction strategies:
| Strategy | Technical Feasibility | Economic Viability | Regulatory Compliance | Operational Impact |
|---|---|---|---|---|
| LNG conversion | High | Medium (high upfront cost) | High (meets current regulations) | Medium (requires new fuel logistics) |
| Scrubber installation | High | High (allows use of cheaper fuel) | Medium (debates over wash water) | Low (minimal operational changes) |
| Slow steaming | High | High (fuel savings) | High | High (schedule disruptions) |
| Wind assistance | Medium (route dependent) | Medium (long payback period) | High | Medium (requires operational adjustments) |
| Biofuel adoption | High | Low (high fuel cost) | High | Low (minimal changes needed) |
This scenario analysis demonstrates that each strategy comes with its own set of trade-offs and considerations across different dimensions.
In conclusion, the challenges in implementing emission reduction strategies in the maritime industry are multifaceted and interconnected. Overcoming these challenges requires a coordinated effort from all stakeholders, including ship owners, operators, technology providers, regulators, and financial institutions. Successful implementation of emission reduction strategies will likely require a combination of technological innovation, supportive policies, new financing models, and a shift in industry culture towards prioritizing environmental sustainability. As the urgency to address climate change and air pollution grows, finding ways to navigate these challenges effectively will be crucial for the future of the maritime industry.
